Data Science: How do I get started?
In this blog we’re going to show you how to do one of the Kaggle Introduction competitions without needing to learn a new language.
Who’s Survived?
The competition we’re going to solve is the Titanic, in this we have 2 data sets, train and test. The train dataset has a labelled column, Survived, where 1 = Yes, survived and 0 = No, didn’t survive. To solve this, we’re going to use a Binary Classifier (Supervised Learning Model).
Step 1 – Acquire the Data: Navigate to Kaggle and download the data files from the Titanic Competition.


Step 3 – Enrich the Data: Once the data is loaded, open the data source and look to enrich the data. There are many areas to enrich, Passenger Title, Cabin Level and. Once enriched makes sure you click on “Apply Script”.
Open the Train Data Set:

Creating the Feature “Title”
Right click on the name column and left click on Split.

For the first split, use the “,” and increase the “Number of Parts” to 2.

On the new columns “Name Split 2”, Right click and select split again. This time split on “.”. This will create a new column with the Titles in.

Family Size:
Right click on “Parch” and select Duplicate. Right click on the new column created and left click on Edit.

In the edit box, add together Parch, SibSp and 1 in the formula: #Parch + #SibSp + 1. Rename the column to Family Size.

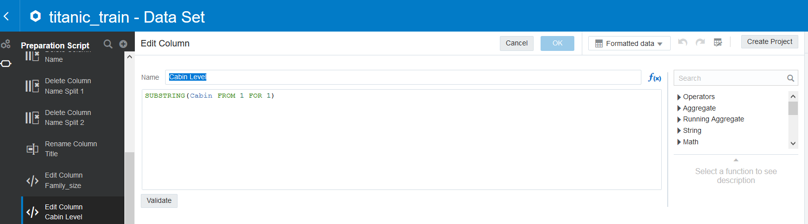
Cabin Level:
Right click on the column Cabin and left click on “Duplicate”. Right click on the new column created and left click on “Edit”. In the edit screen used the function SUBSTRING to extract the first letter from the cabin data.
Note: SUBSTRING(<<Column>>, Starting Position, Number of characters to extract)
Step 4 – Augmented Analytics: Left click on “create project”, this will open a blank canvas. One the left-hand side are the data fields. Right click on “Survived” and select “Explain Survived”.

The explain box will appear on screen and provide a high-level overview of the attribute “Survived”. Left click on the tick in the top right corner. This will indicate the graphs that you want to add to the Canvas.

Left click on “Key Drivers of Survived”. This will present a number of key drivers towards to the variable “Survived”. Once you’ve selected your graphs, click on “Add Selected”.

This will use Oracle in-built machine learning algorithms to describe the attribute “Survived” and provided detailed visualisations that help to explain the attribute “Survived”.

Step 5 – Training the model: Once we have explored the data we’re ready to build a machine learning model. On the home screen left click on “Create” and then “Data Flow”.

The data flow is as follows:
1. The training data source
2. Remove any columns not required in the model
3. Train the Binary Classifier
4. Save the model
In this example we’ve built a Neural Network Supervised Learning Model Ensure you select the correct column that you want to predict (“Survived”) and “0” for the positive class in Target (Most Frequent).

Step 6 – Apply the model: From the home screen create a new Data Flow. This data flow will apply the machine learning model you’ve just created to the test data set.
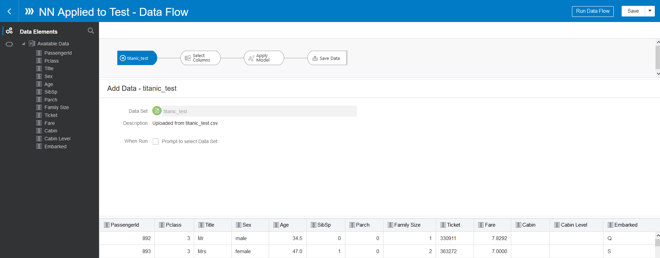
The data flow is as follows:
1. The training data source
2. Remove any columns not required in the model
3. Apply the machine learning model
4. Save the result data set
When applying the model, you can rename the columns in this example “PredictedValue” is renamed to “Survived”.

Step 7 – Prepare for submission: For the Kaggle competition the file that needs to be uploaded should only contain 2 columns, the PassengerID and Survived (i.e. the predicted values from the model). The resulting data set can be downloaded and then submitted to Kaggle for a score.

Step 8 – The final frontier: Once you have downloaded the file you can upload the results to Kaggle to get your first Data Science score.

No comments:
Post a Comment